Senseware Indoor Air Quality Sensor (Node)
CO2 sensors are used to control ventilation systems and monitor indoor air quality. They can be stand-alone sensors or integrated into thermostats or air quality monitoring platforms.
Learn MoreIf you are experiencing issues with the comparison tool, please disable your adblocker.
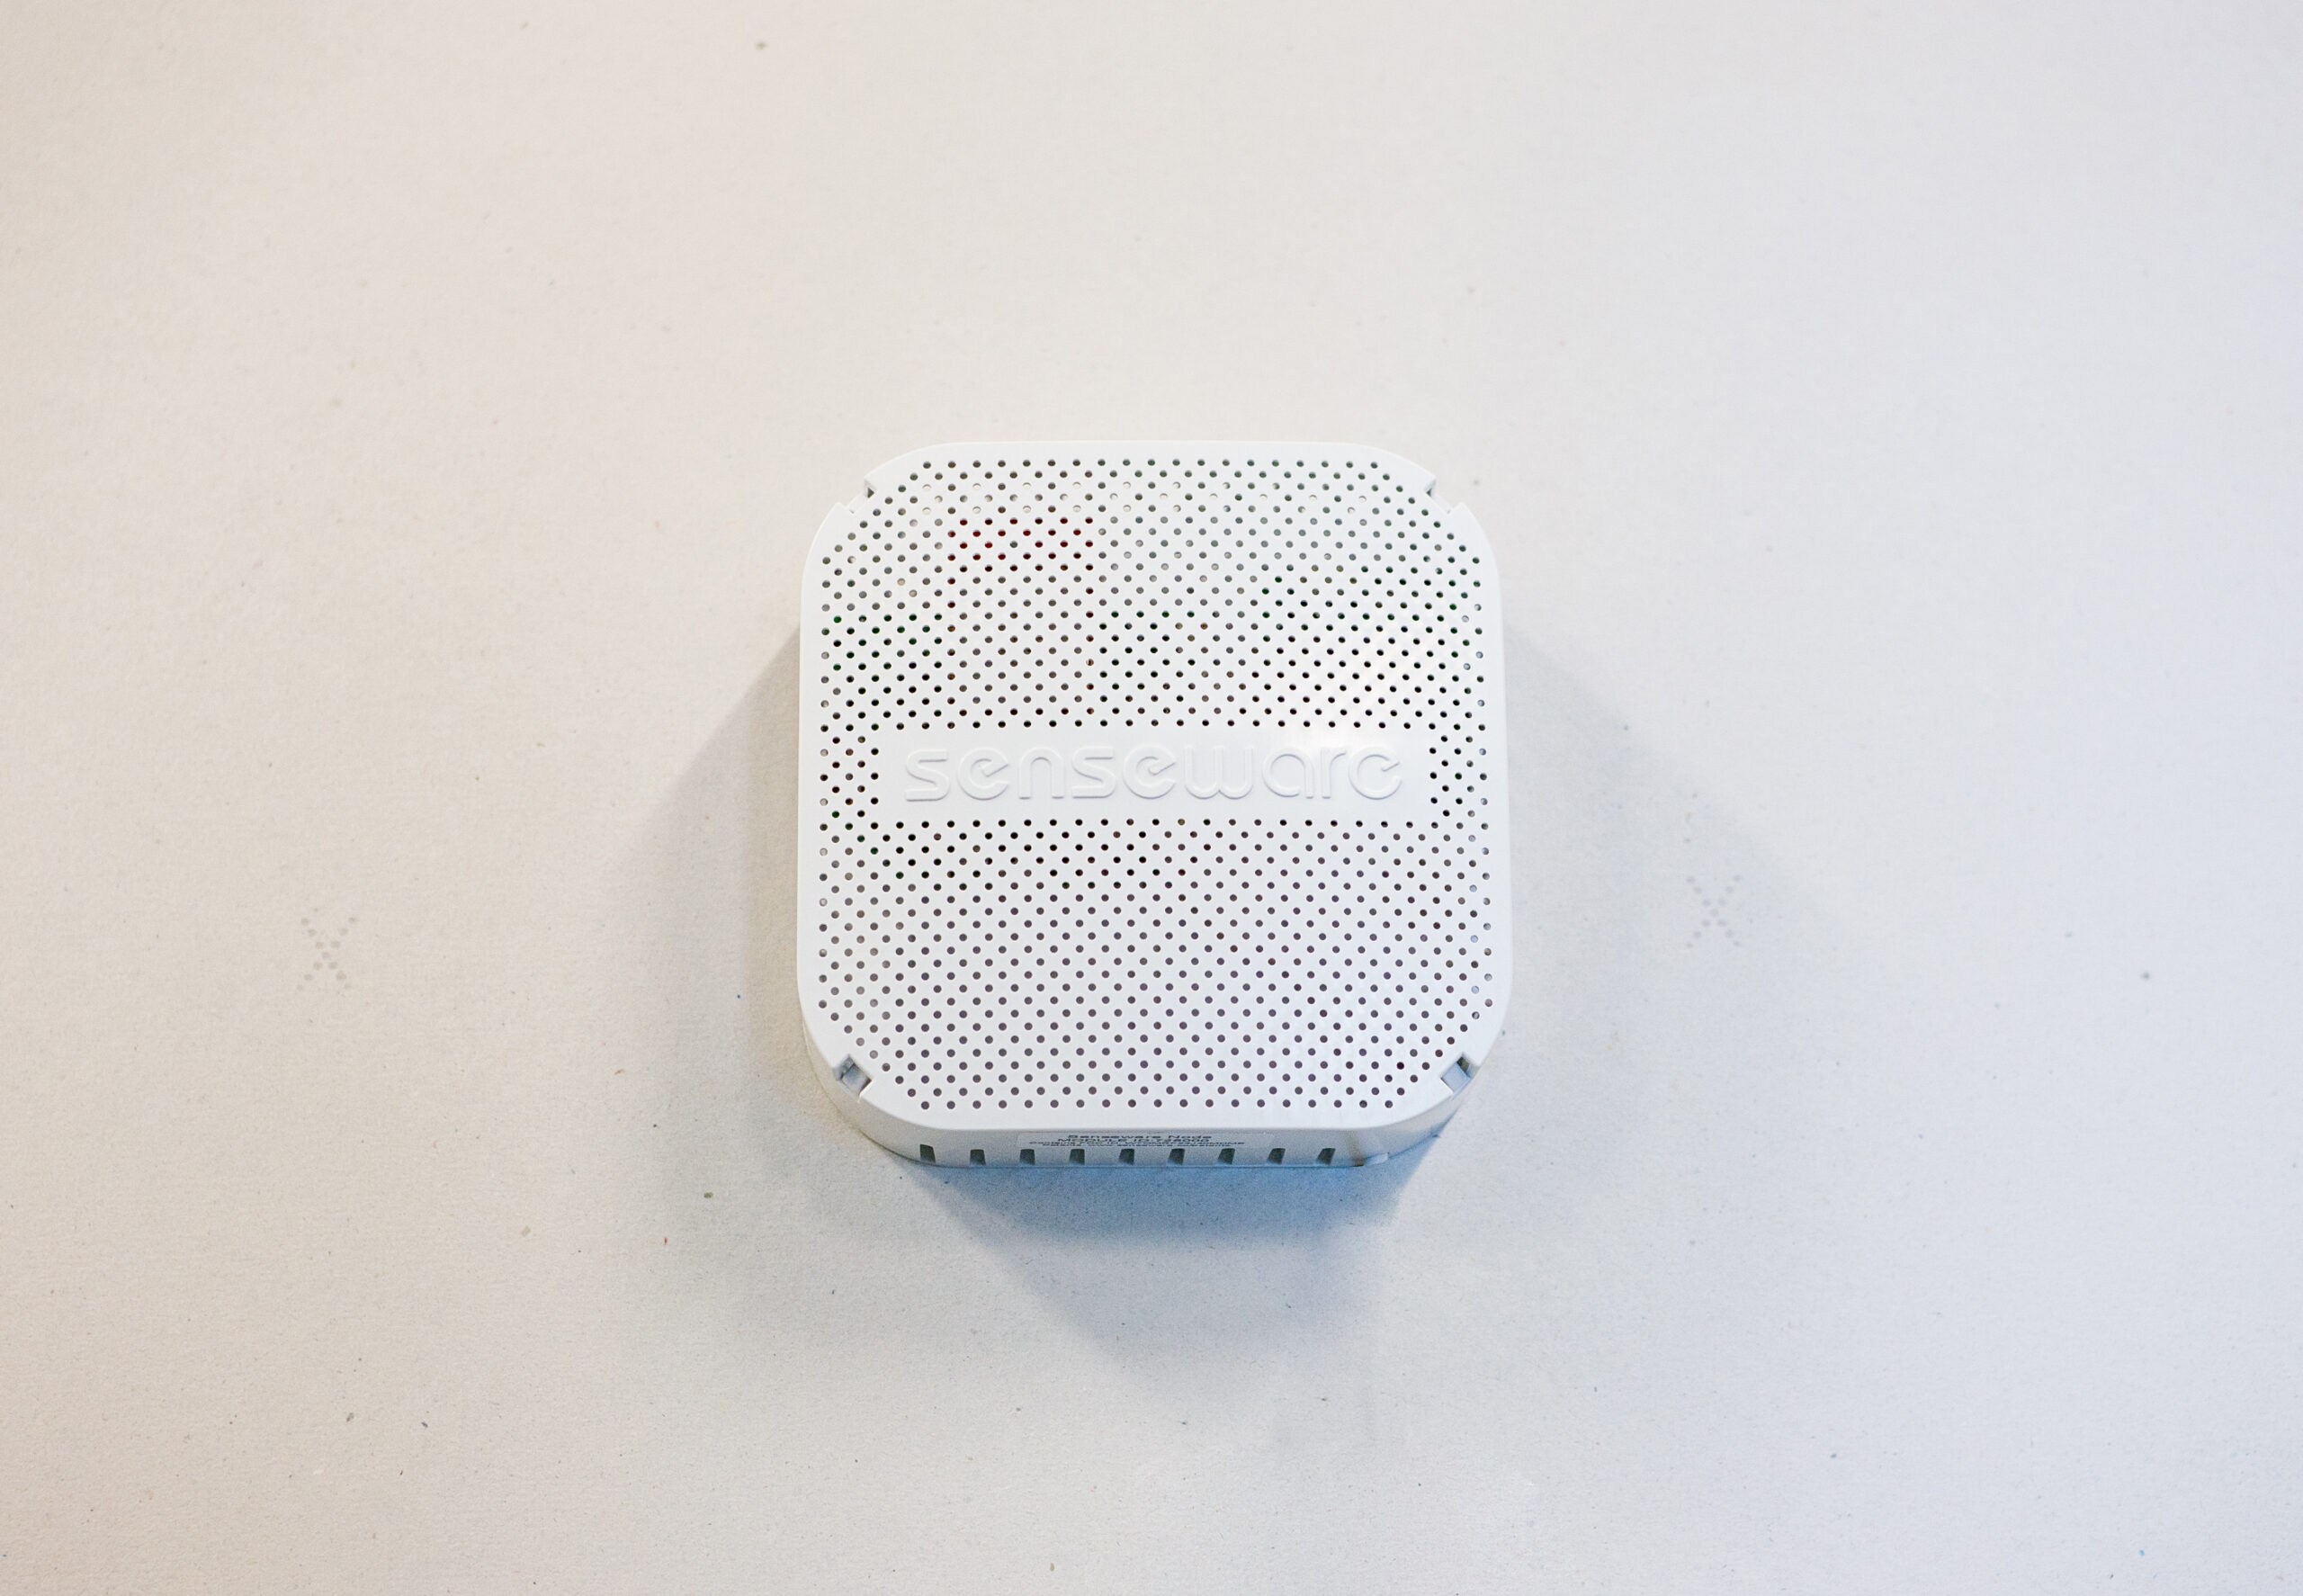
Senseware Indoor Air Quality Sensor (Node)
Senseware is an indoor air quality monitoring platform with a customizable web-based dashboard that can be used for long-term monitoring.
Hub Highlights:
- No display on device. Display of CO2 value only available through web-portal which can be publicly accessible
- Can connect to building automation system through Siemens Connect ecosystem
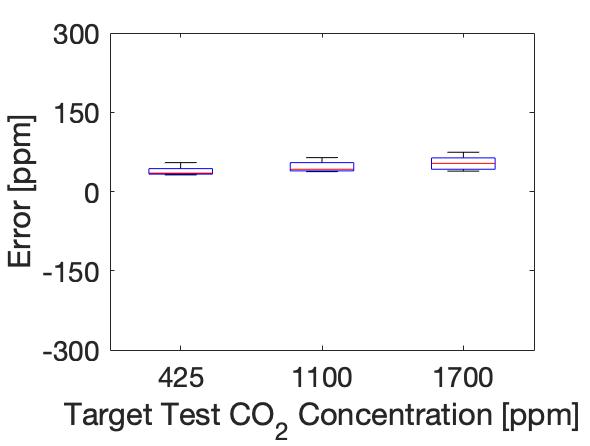
- Excellent performance on Hub CO2 accuracy testing protocols
- Optional sensors include CO2, temperature, humidity, particulate matter, ozone, and others
Last Edited on: Sep 30, 2021
| Model | Indoor Air Quality Sensor (Node) |
| Date of Test (including warm-up period if device uses automatic background calibration) | June 3-8, 2021 |
| Sample Size | 5 |
|
Error of CO2 measurement @1100 ppm (average) (ppm)
|
47 |
|
Error of CO2 measurement @ 1100 ppm (standard deviation) (ppm)
|
11 |
|
Accuracy Metric
|
<±75ppm |
|
Noise of CO2 measurement @1100 ppm (Average) (ppm)
|
0.6 |
|
CO2 Full results
|
See Box Plot |
| Operating Power for Sensor (watts) | 0.41 |
| Operating Power for Gateway (watts) | 1.29 |
|
Operating Power for Sensor + Gateway (watts)
|
0.42 |
|
Operating Power Metric
|
<±0.5 W |
| Maximum Number of Sensors per Gateway | No limit |