Energy & Cost Impacts: Building Automation Systems

The maximum energy savings from implementing a Building Automation System (BAS) was modeled in the Pacific Northwest National Laboratory (PNNL) report #25985 titled “Impacts of Commercial Building Controls on Energy Savings and Peak Load Reduction”. The modeling considered 43 controls-enabled energy saving measures applied to nine commercial building types. A range of savings estimates were made for each building type based on three baseline levels of BAS control or groups of existing energy saving measures (None, Typical and Advanced), by comparing that baseline to the scenario of that building type with a completely installed and commissioned BAS that produces ideal control. This modeling does not differentiate between different BAS products; it assumes all BAS can provide the similar energy savings.
The Building Automation System (BAS) energy and cost savings analysis presented below builds on the PNNL estimates by factoring in the energy consumed by each BAS product line, which differs by building type and vintage, and climate zone. The baseline energy used by the nine building types used in PNNL’s modeling was extracted from the DOE commercial reference buildings for three vintages (pre-1980, post 1980, and post-2004), and two IECC climate zones (3B and 3C, representing 97% of the population in California* according to the United States Census Bureau). The net annual energy consumption of the BAS per thousand square feet of building floor space is calculated for each building type. For this analysis, it is assumed that up to 17 of the 43 the energy saving measures are achieved by applying a BAS.
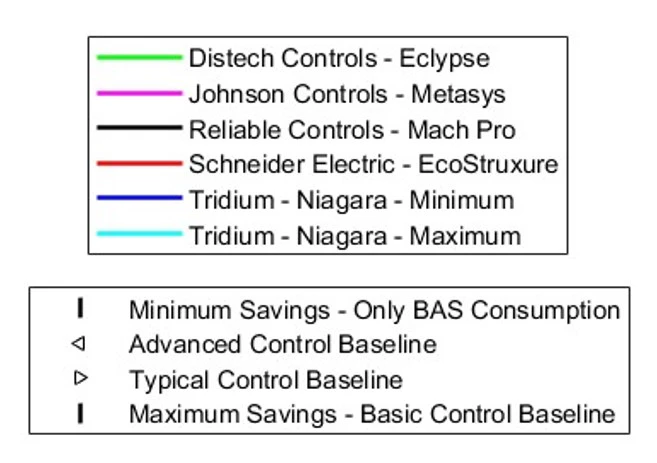
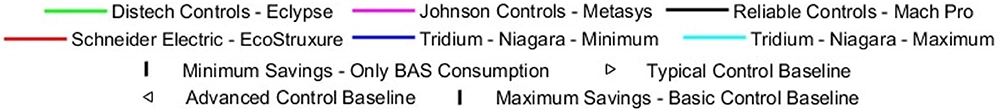
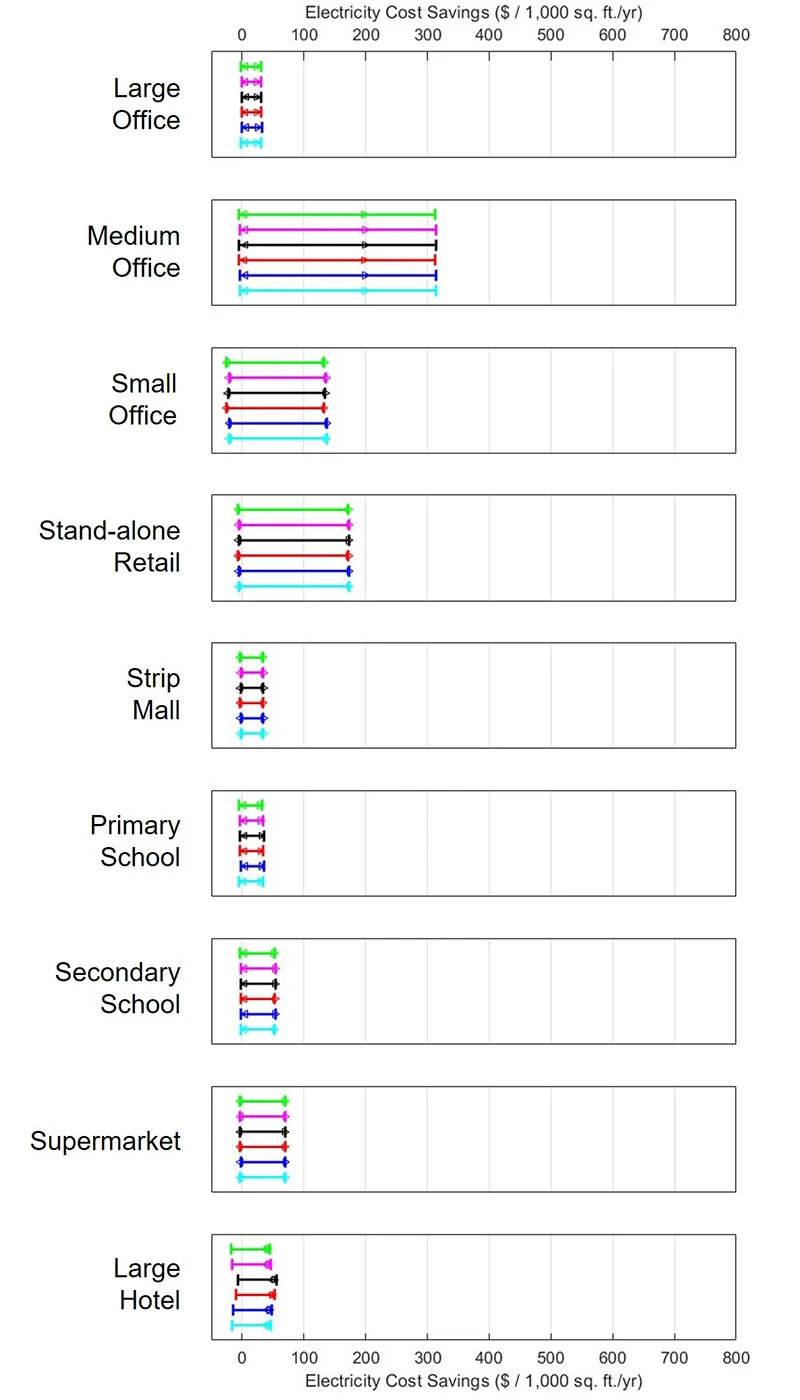
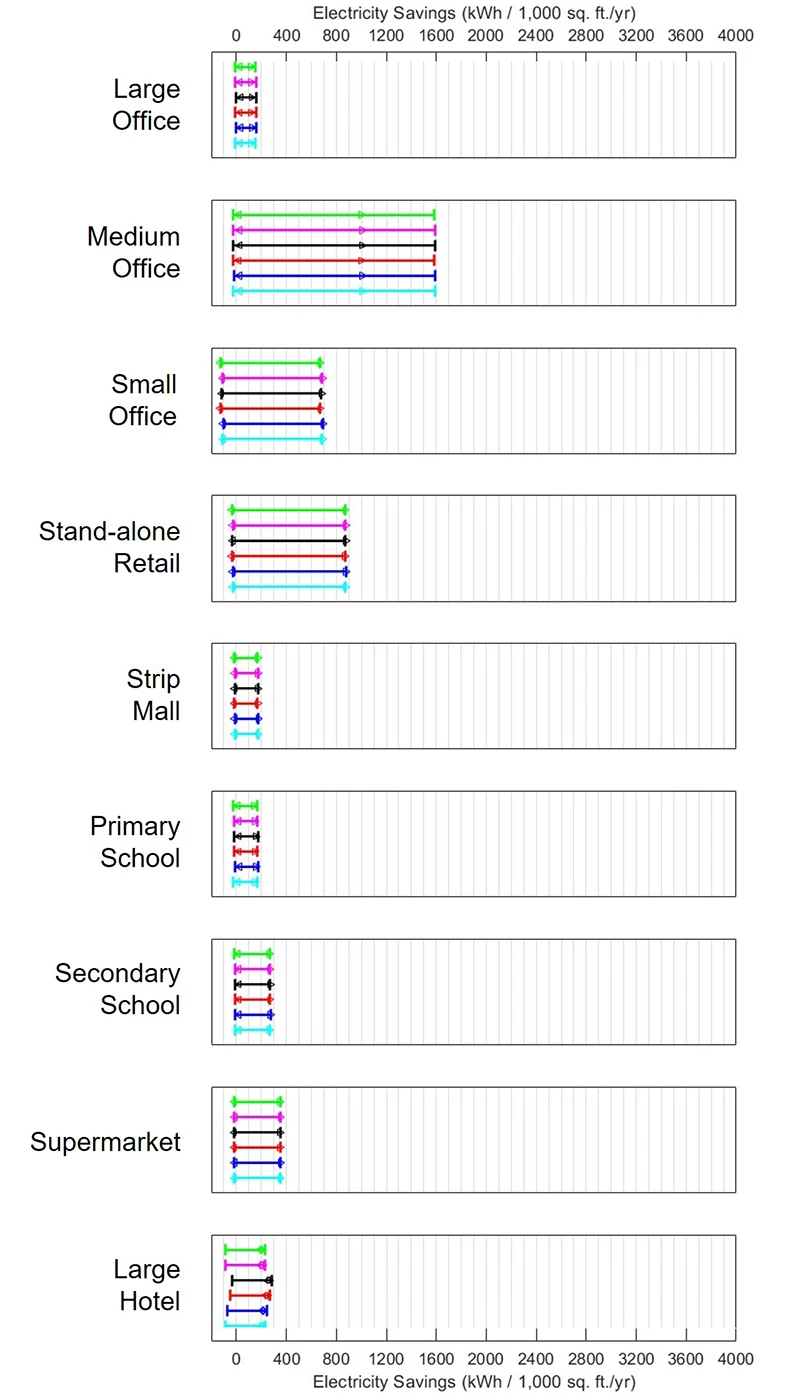
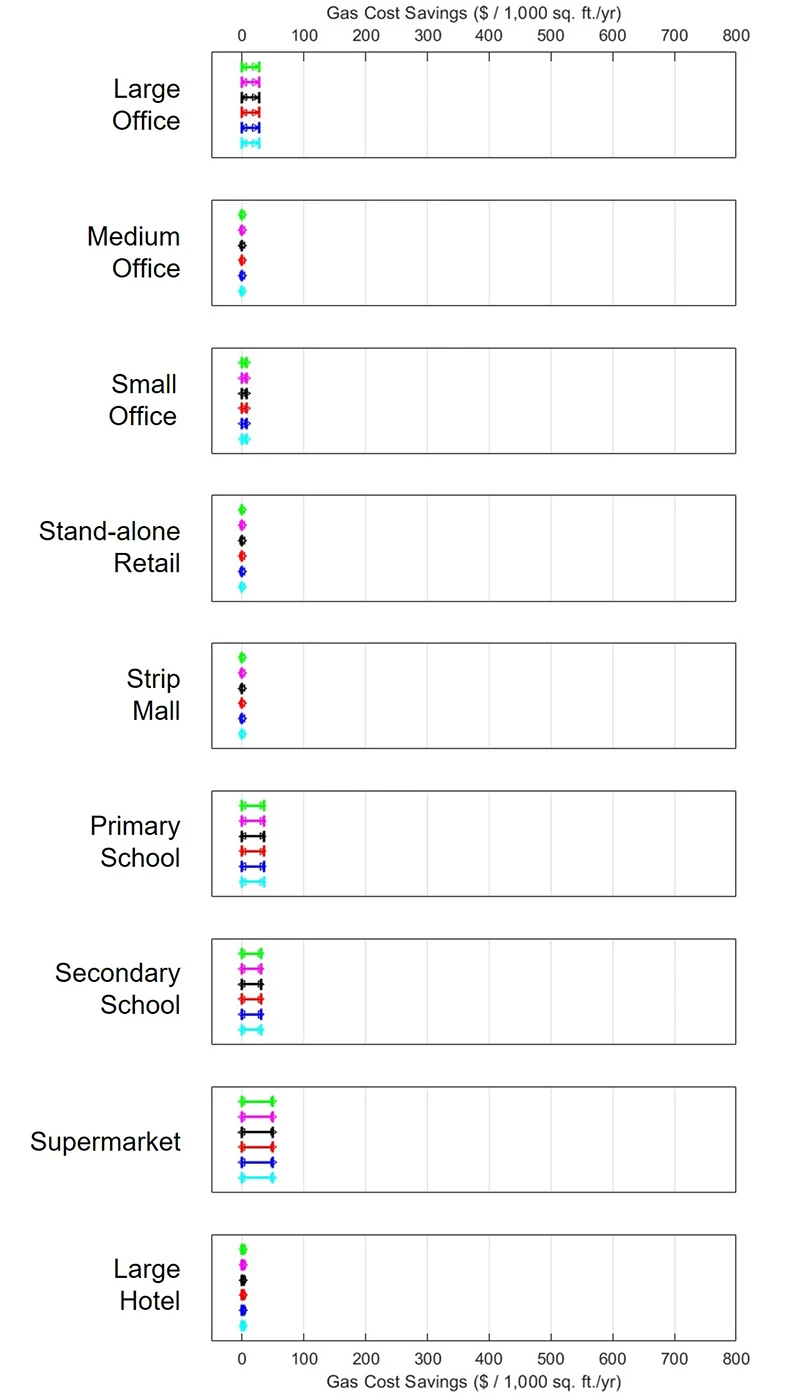
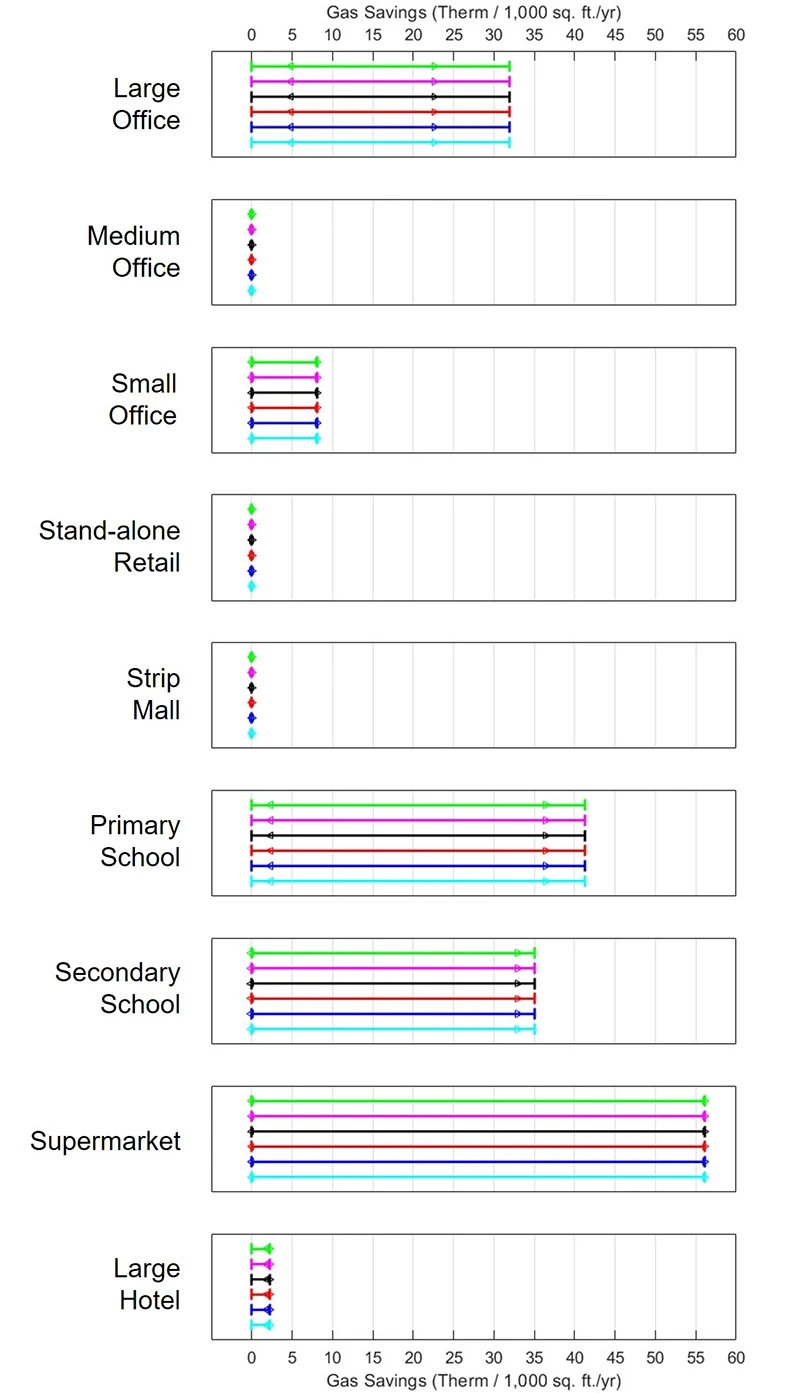
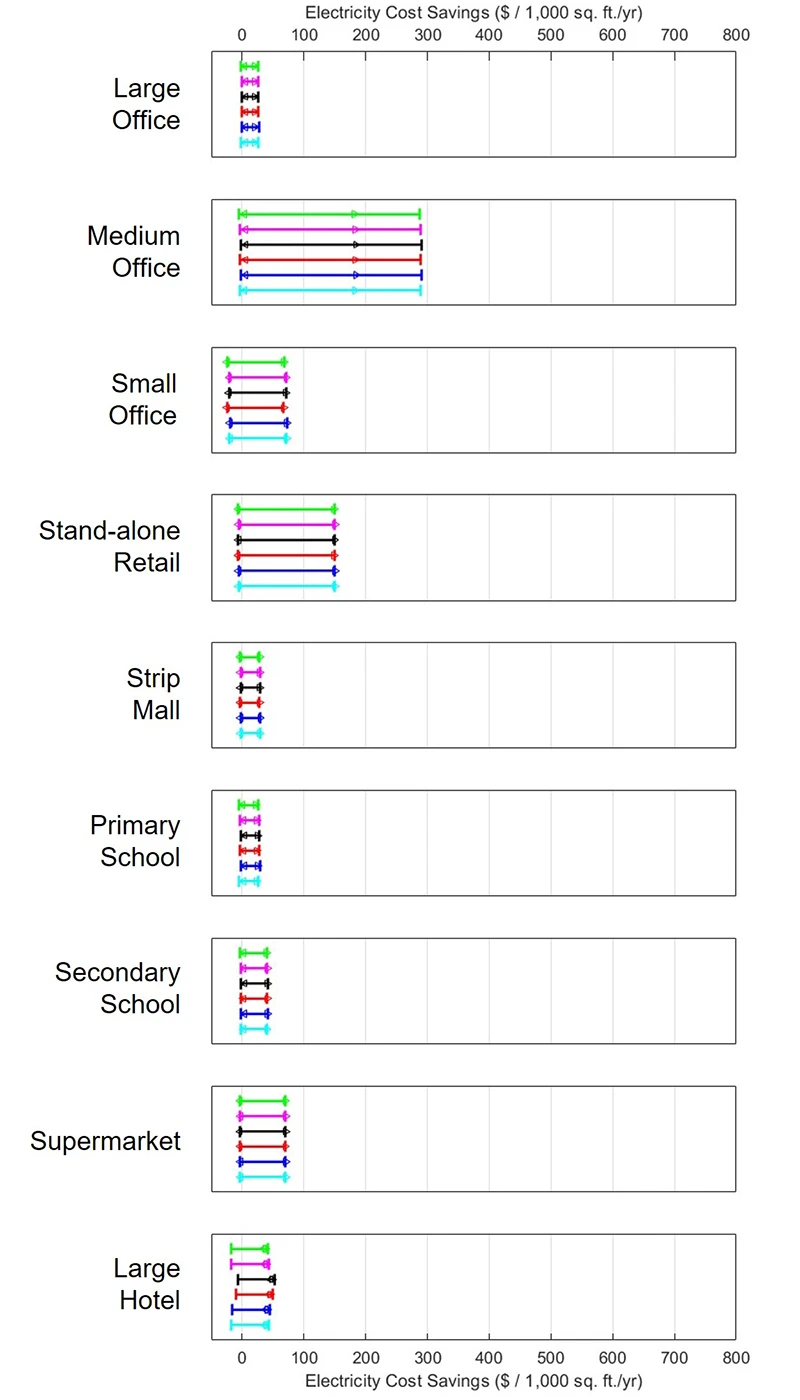
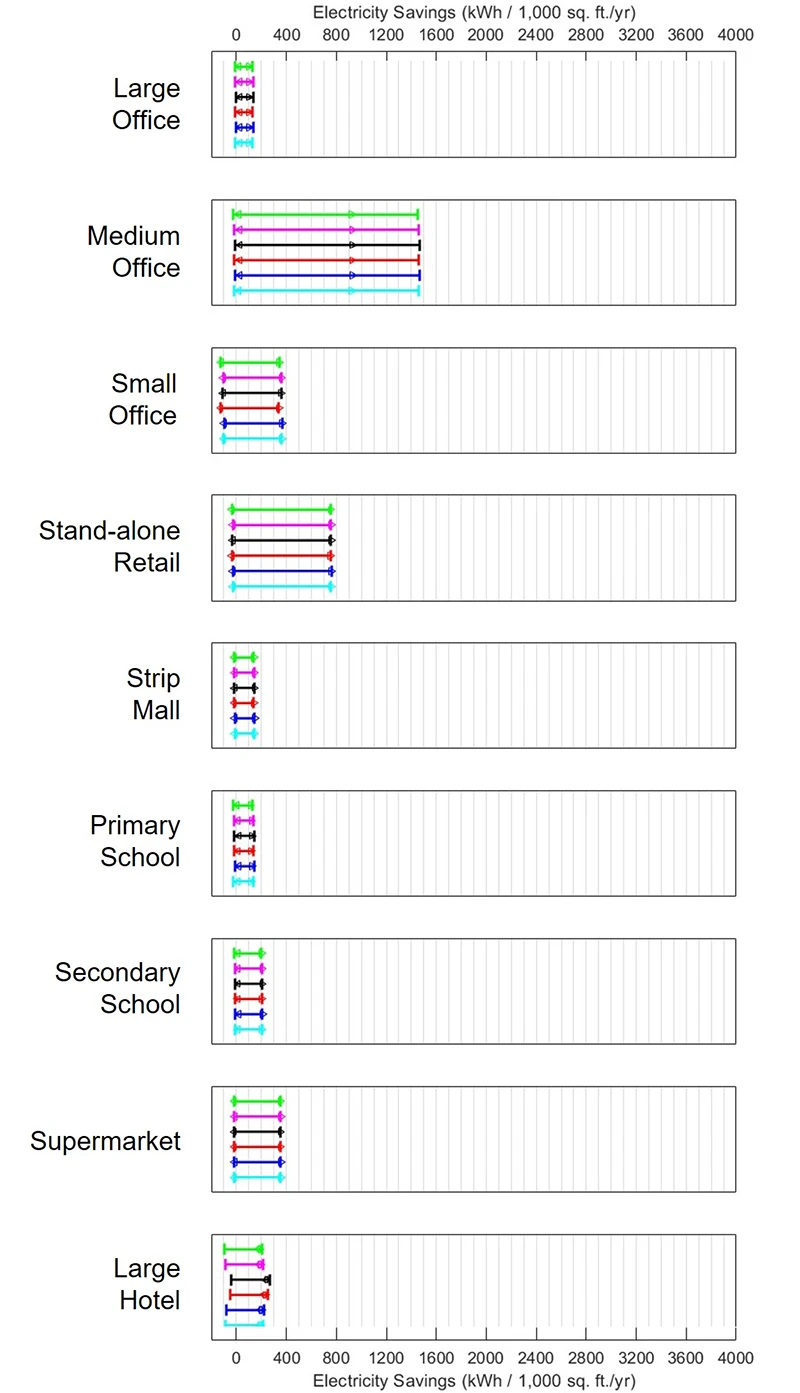
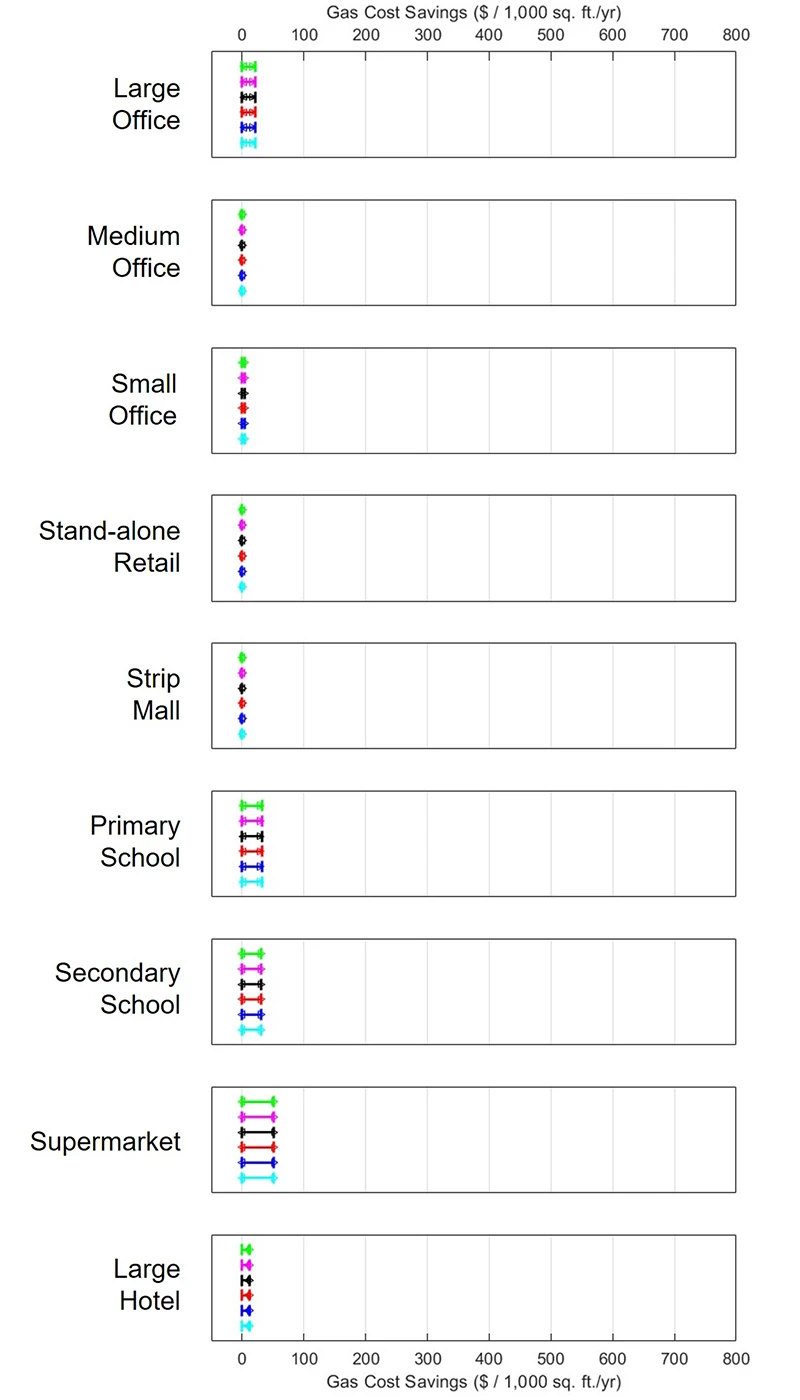
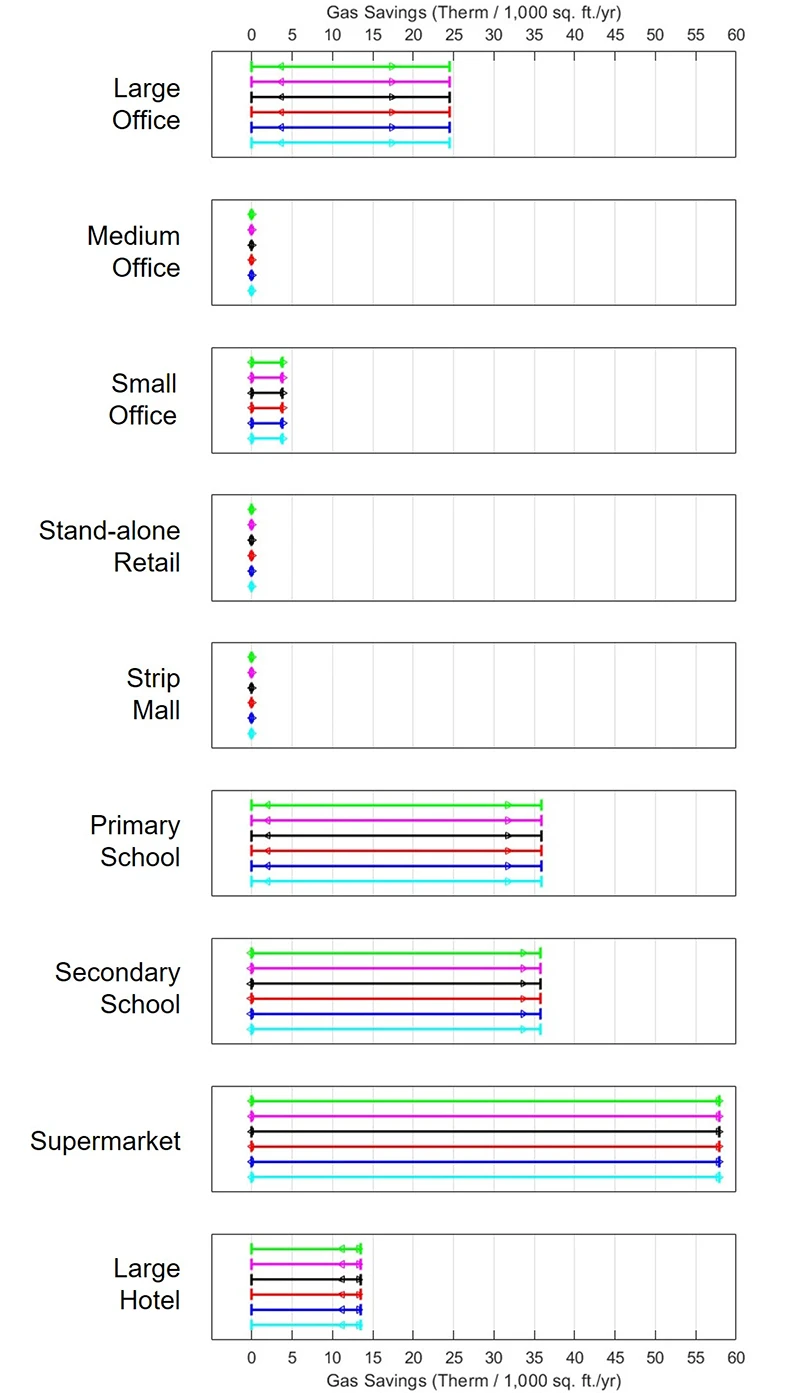
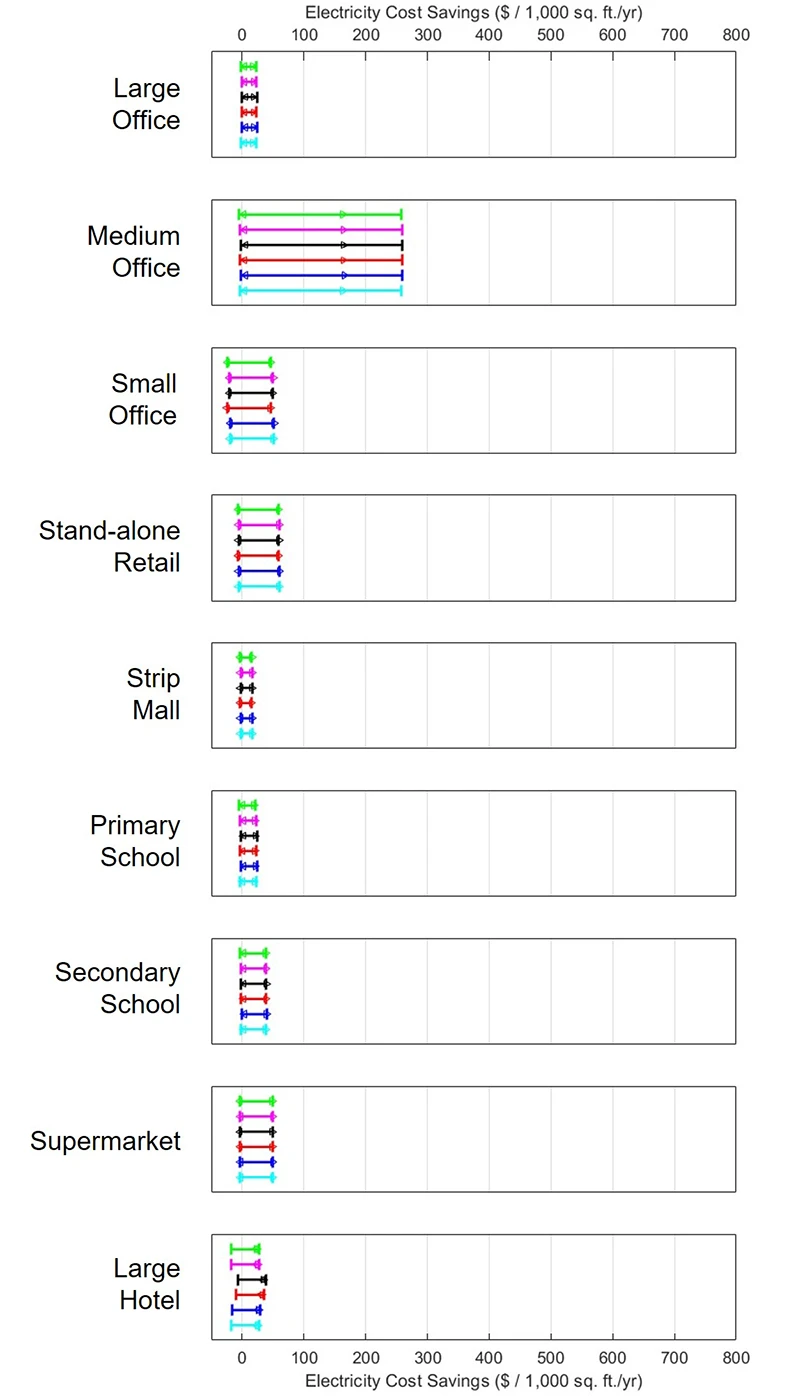
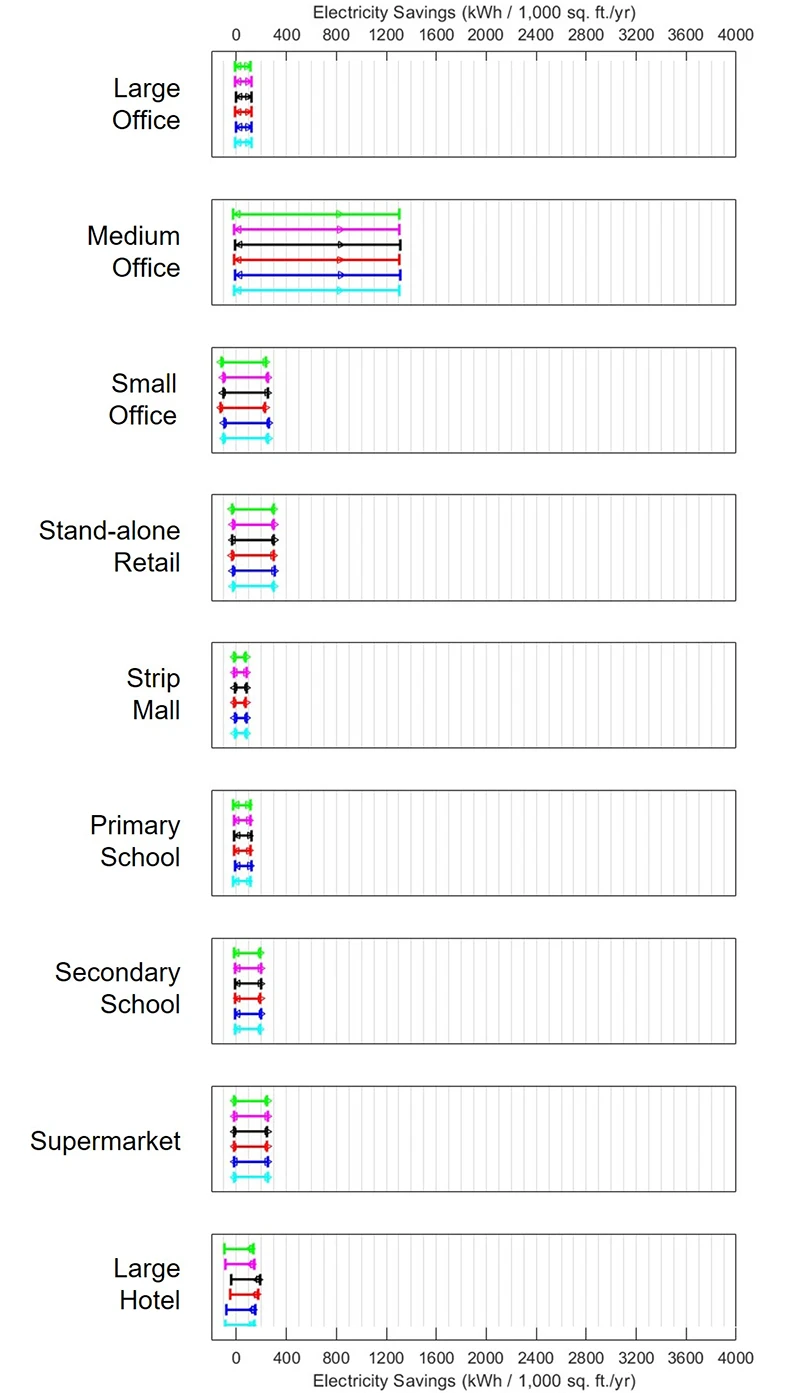
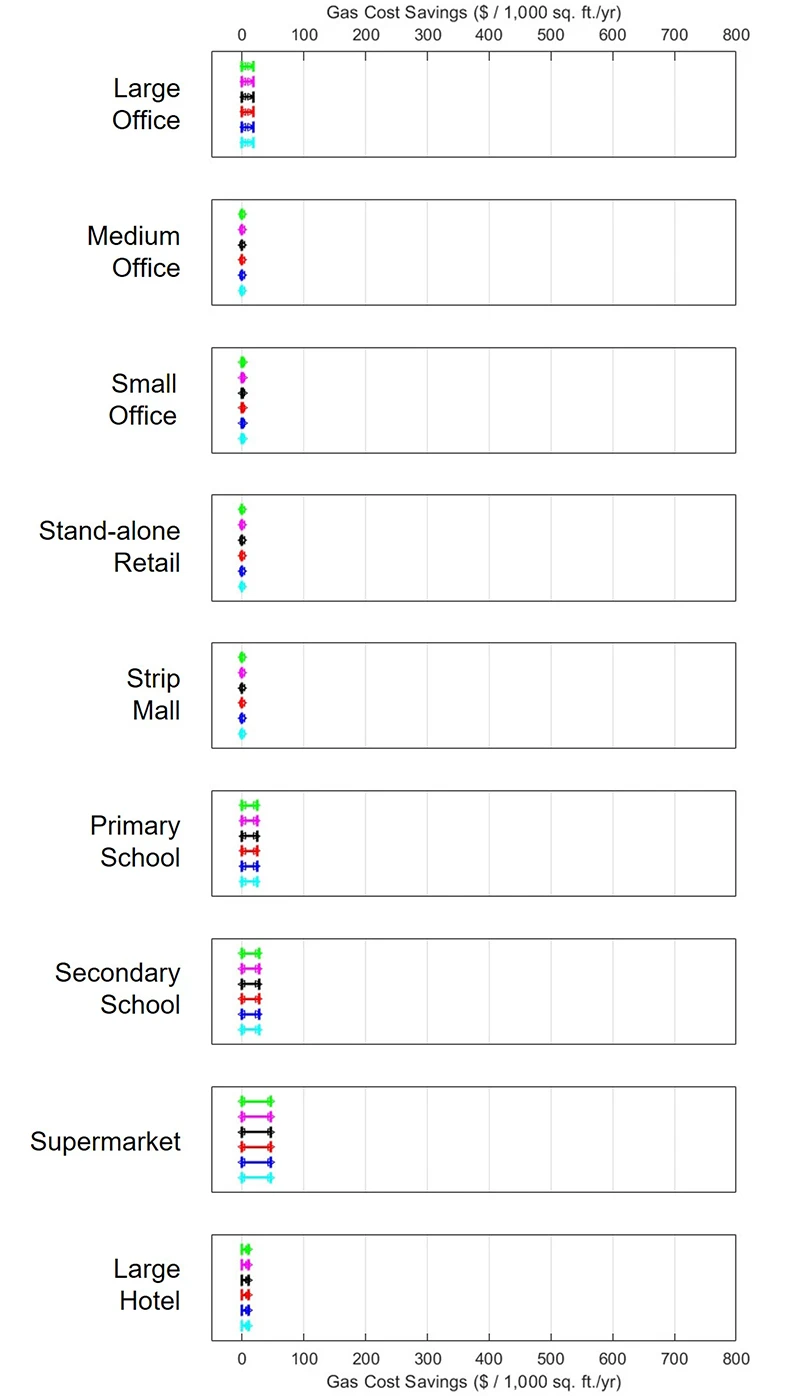
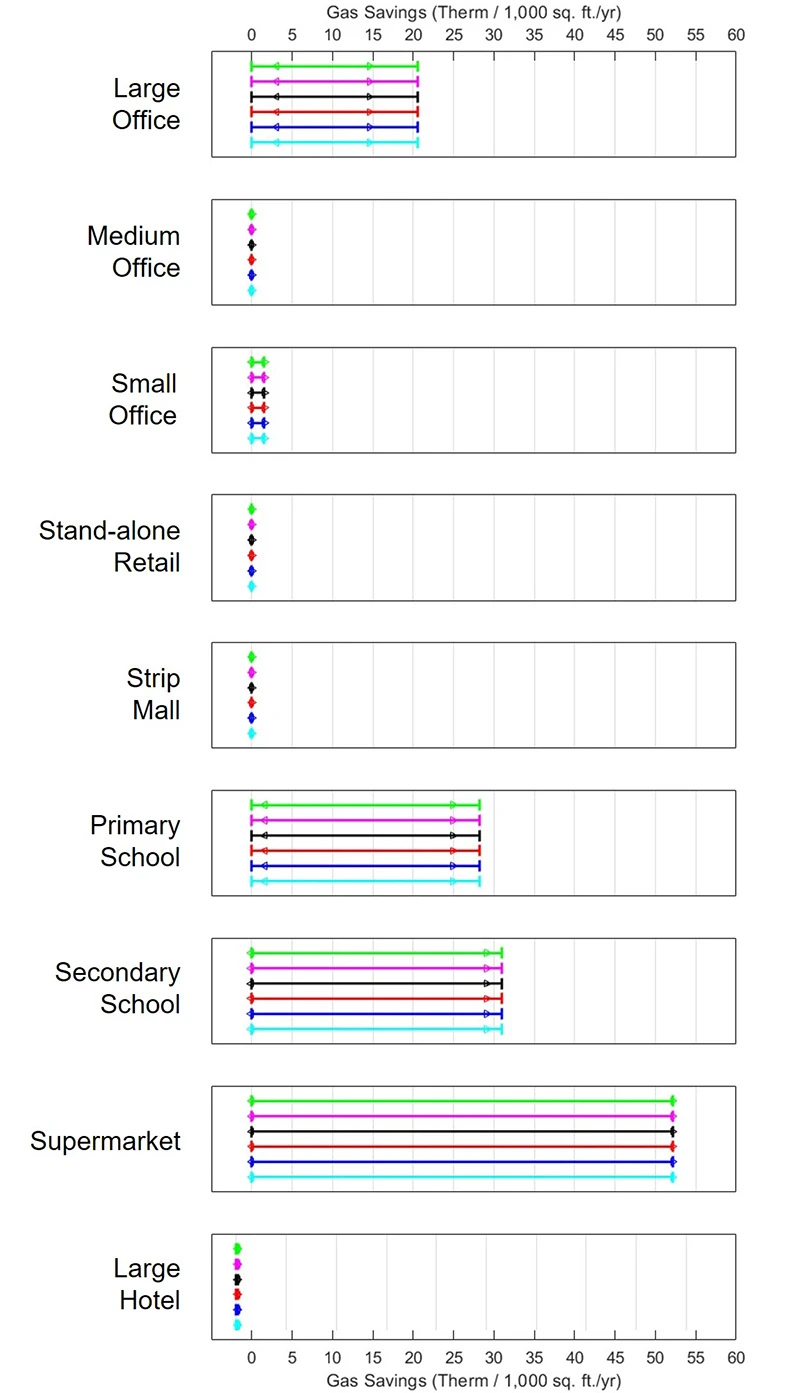
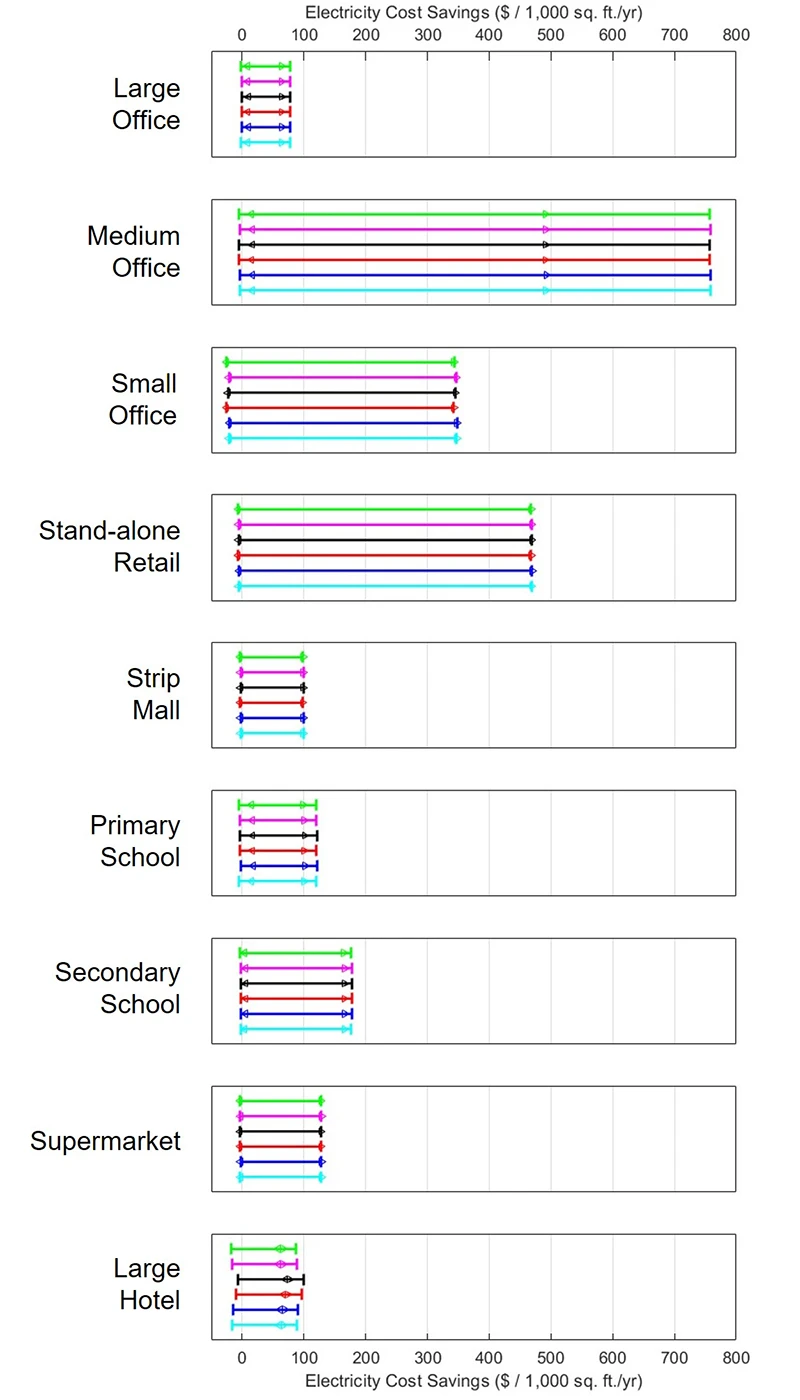
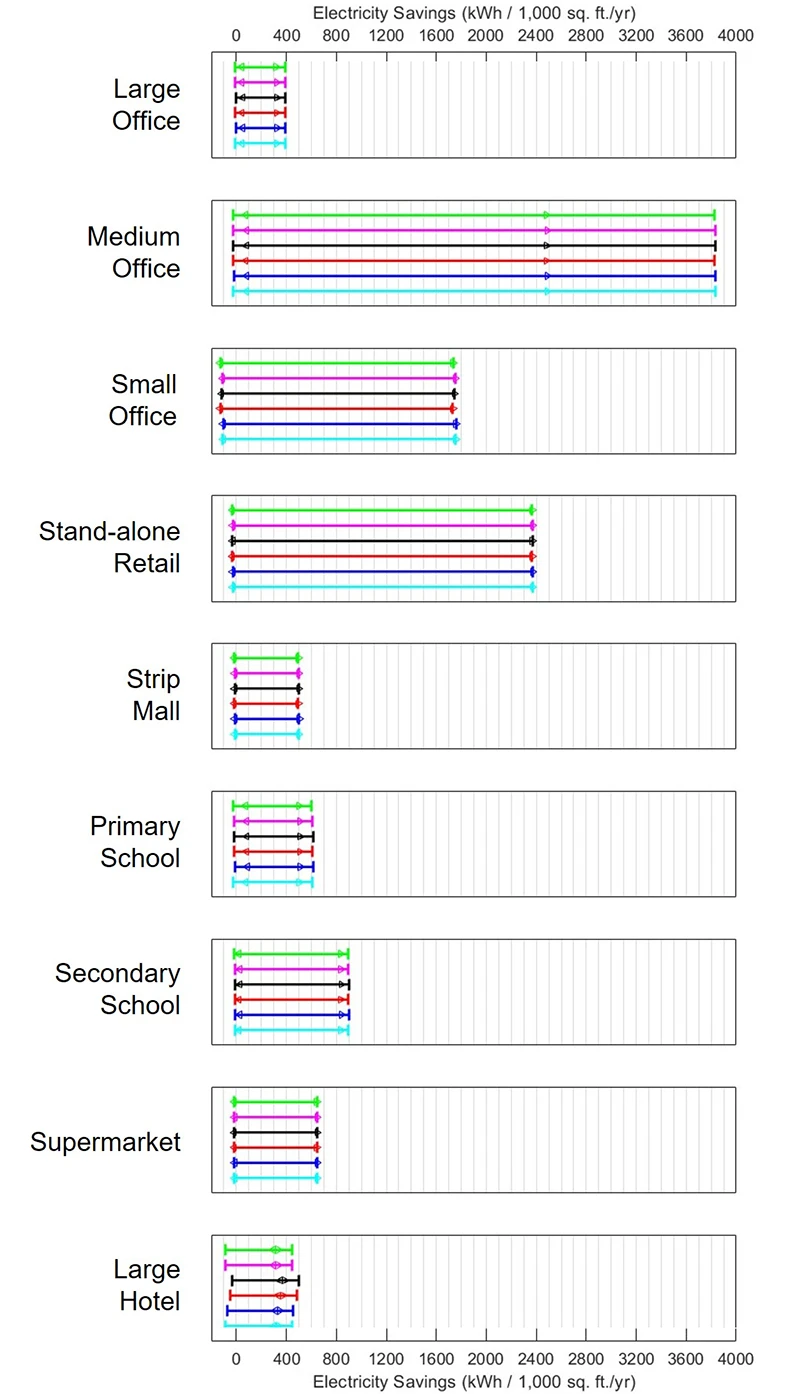
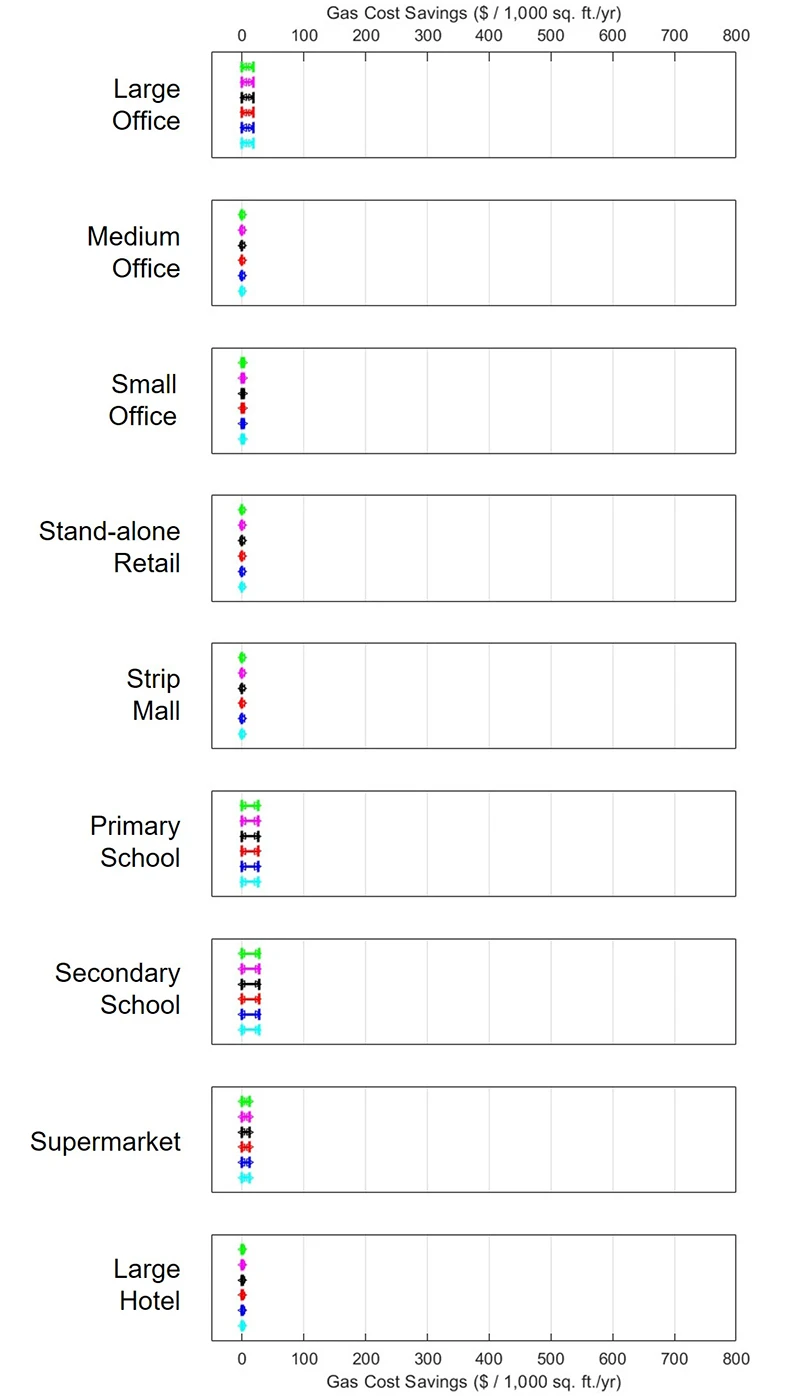
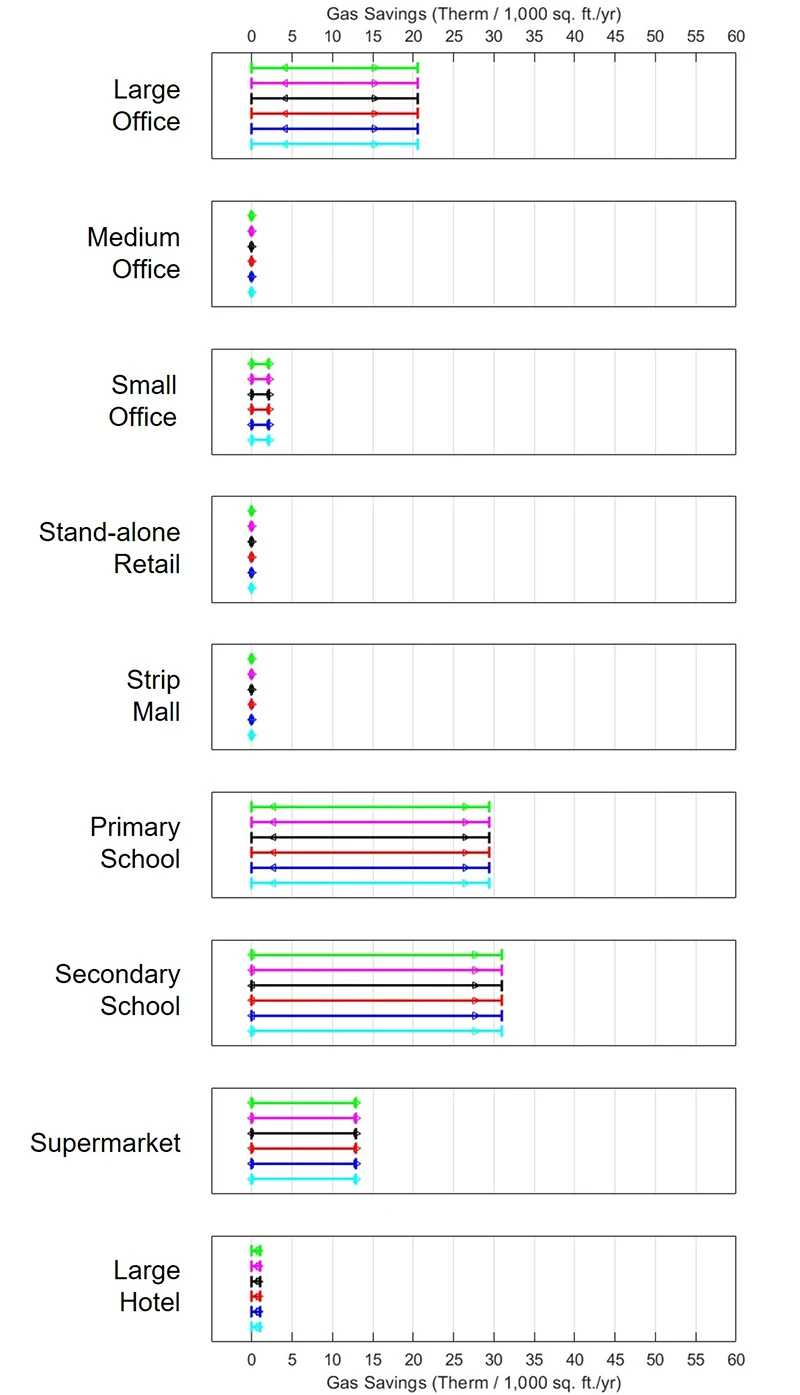
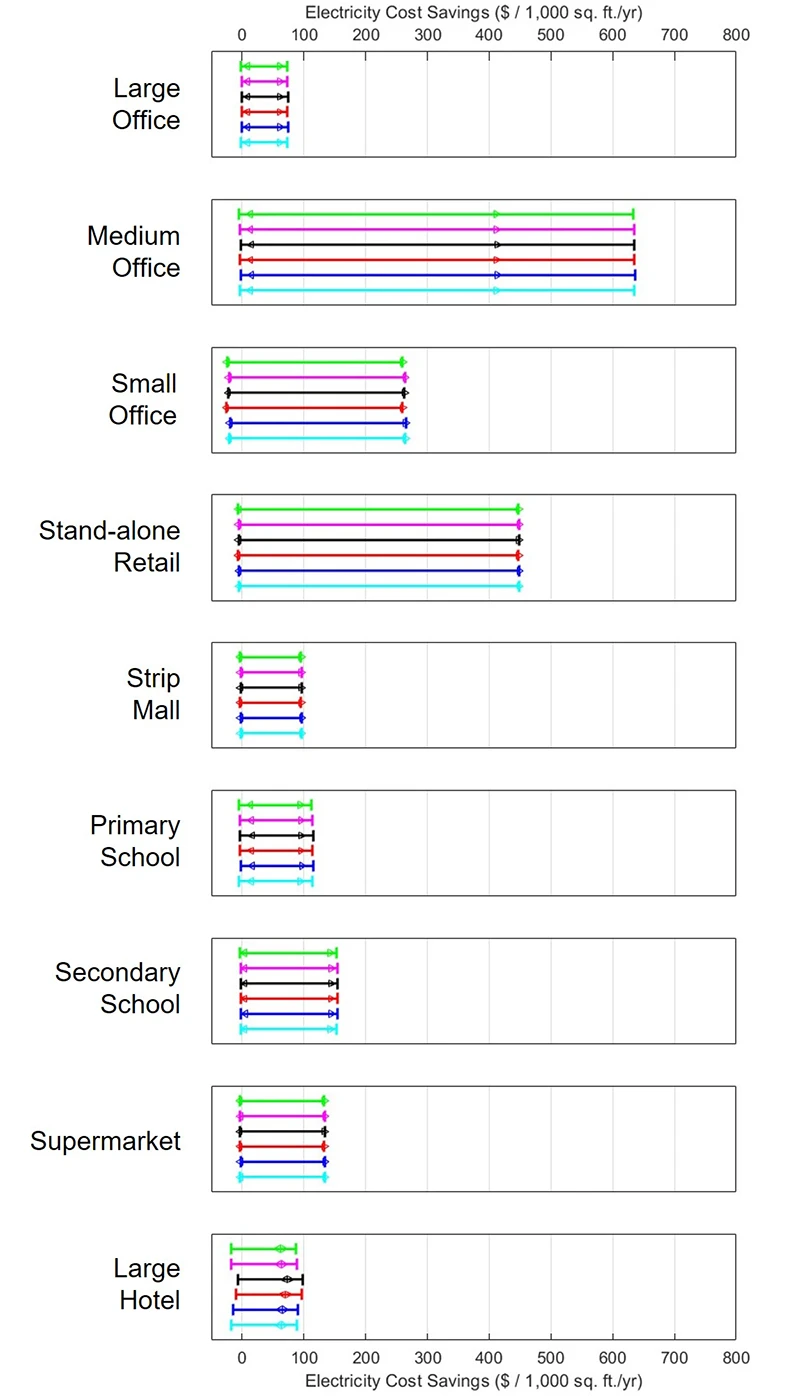
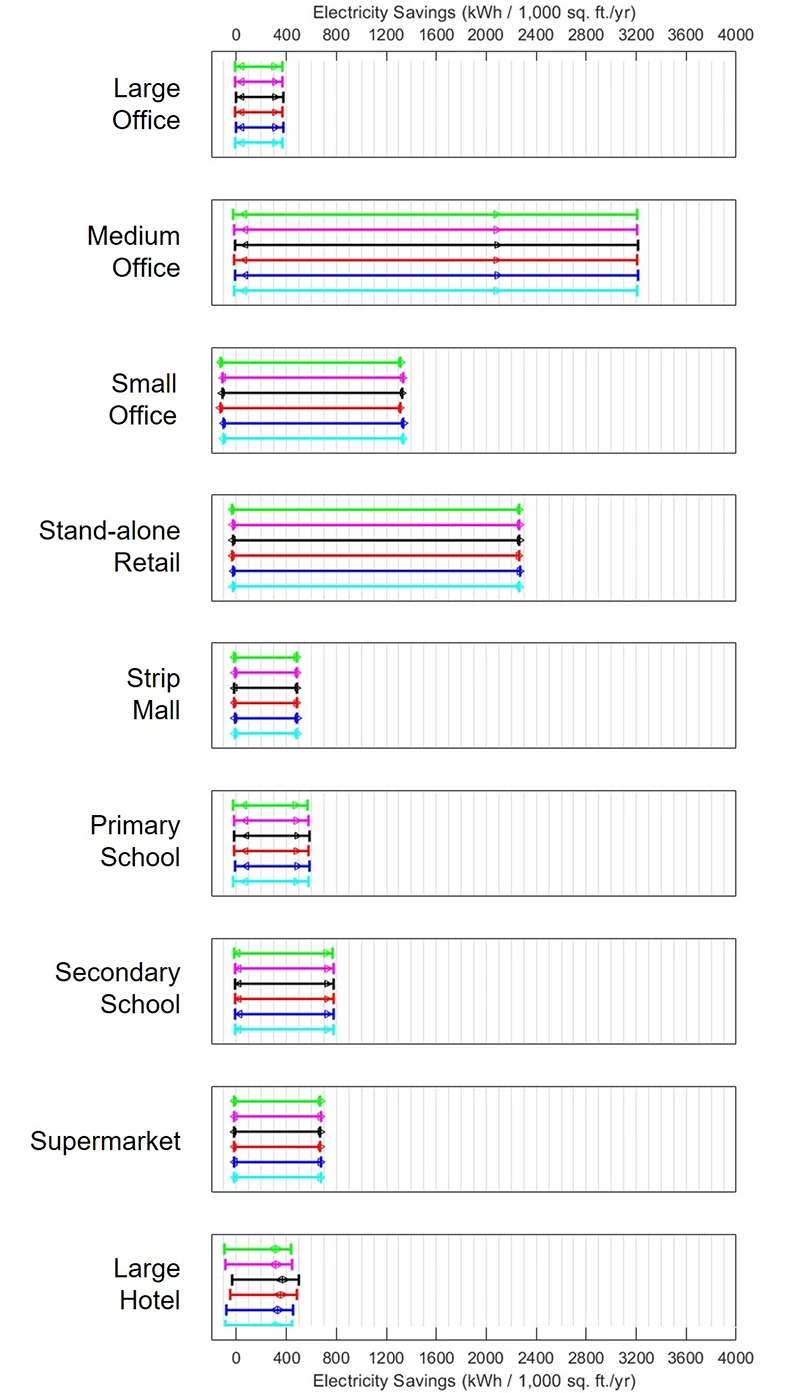
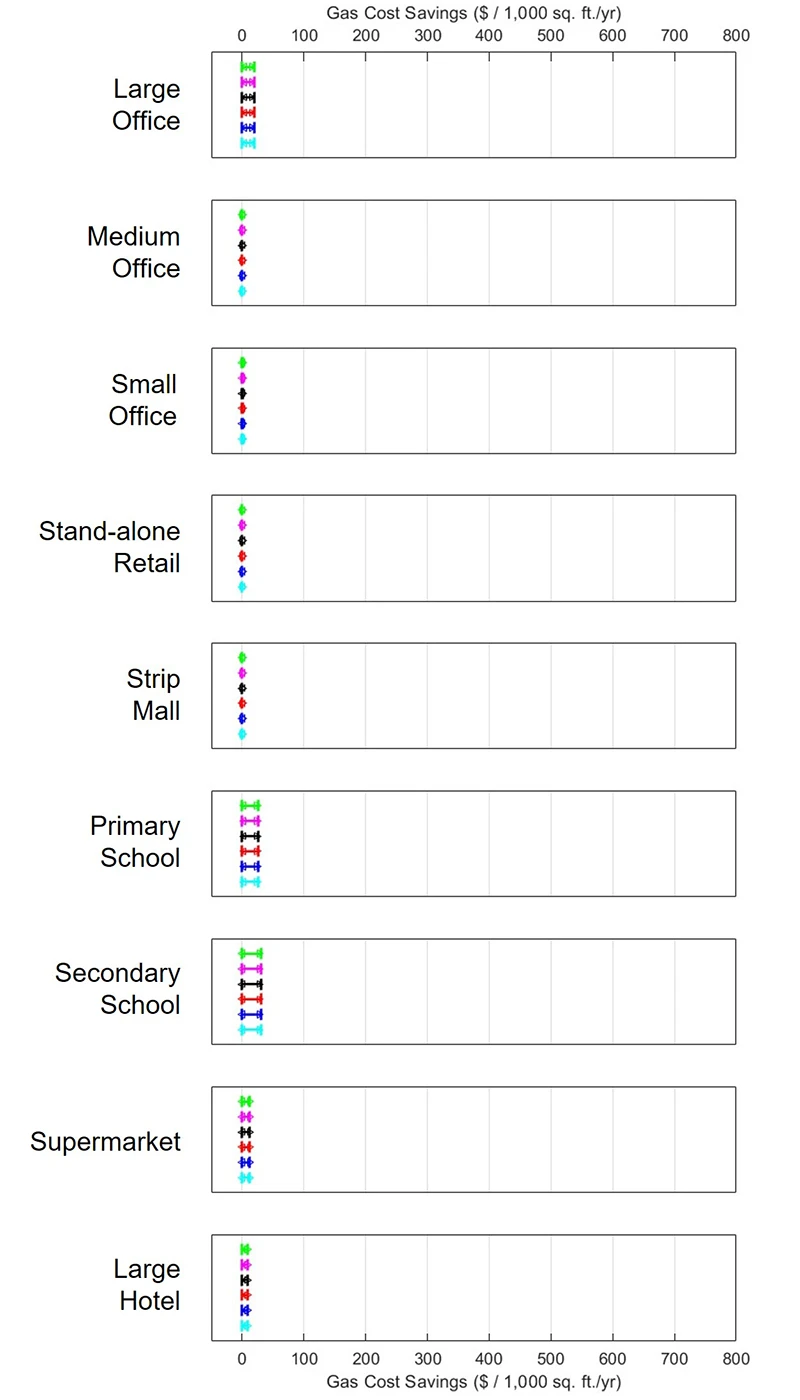
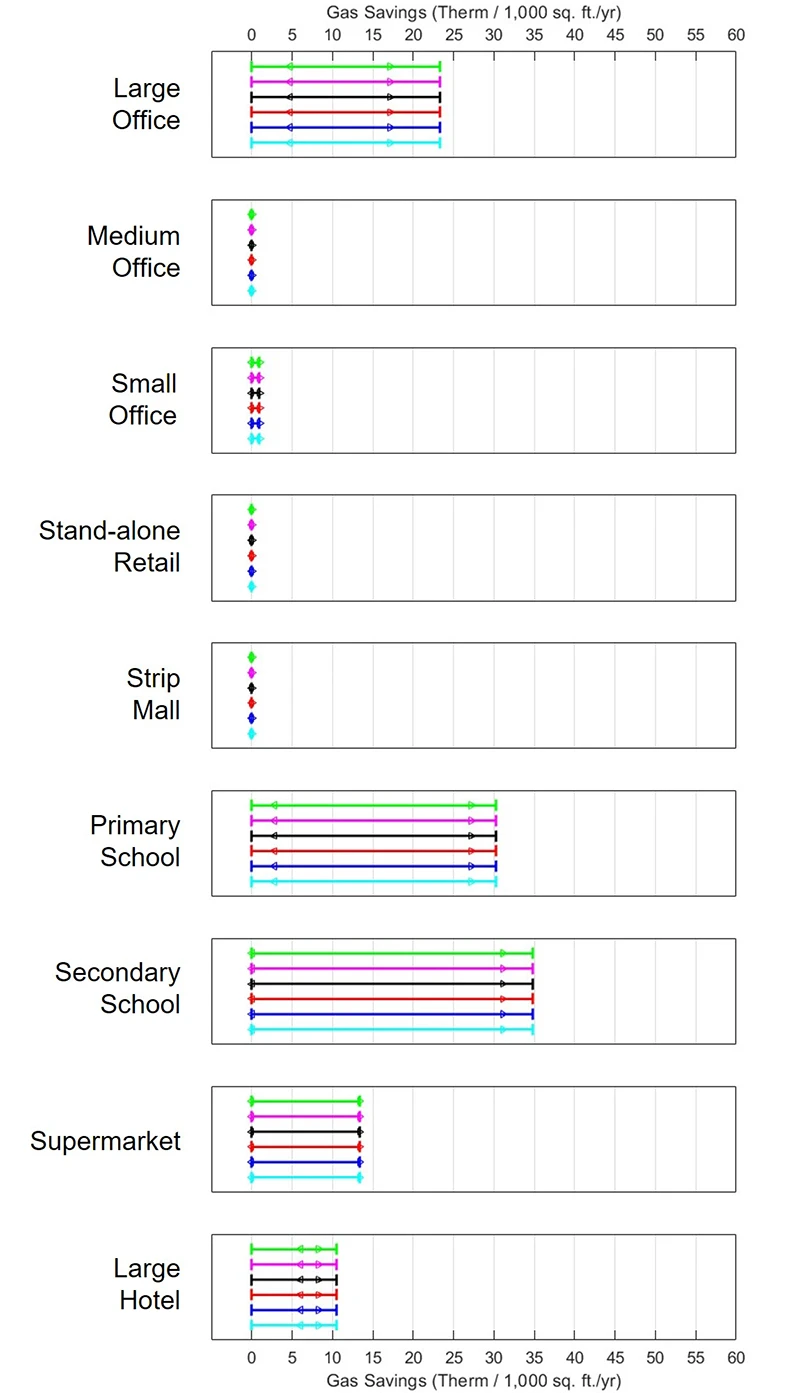
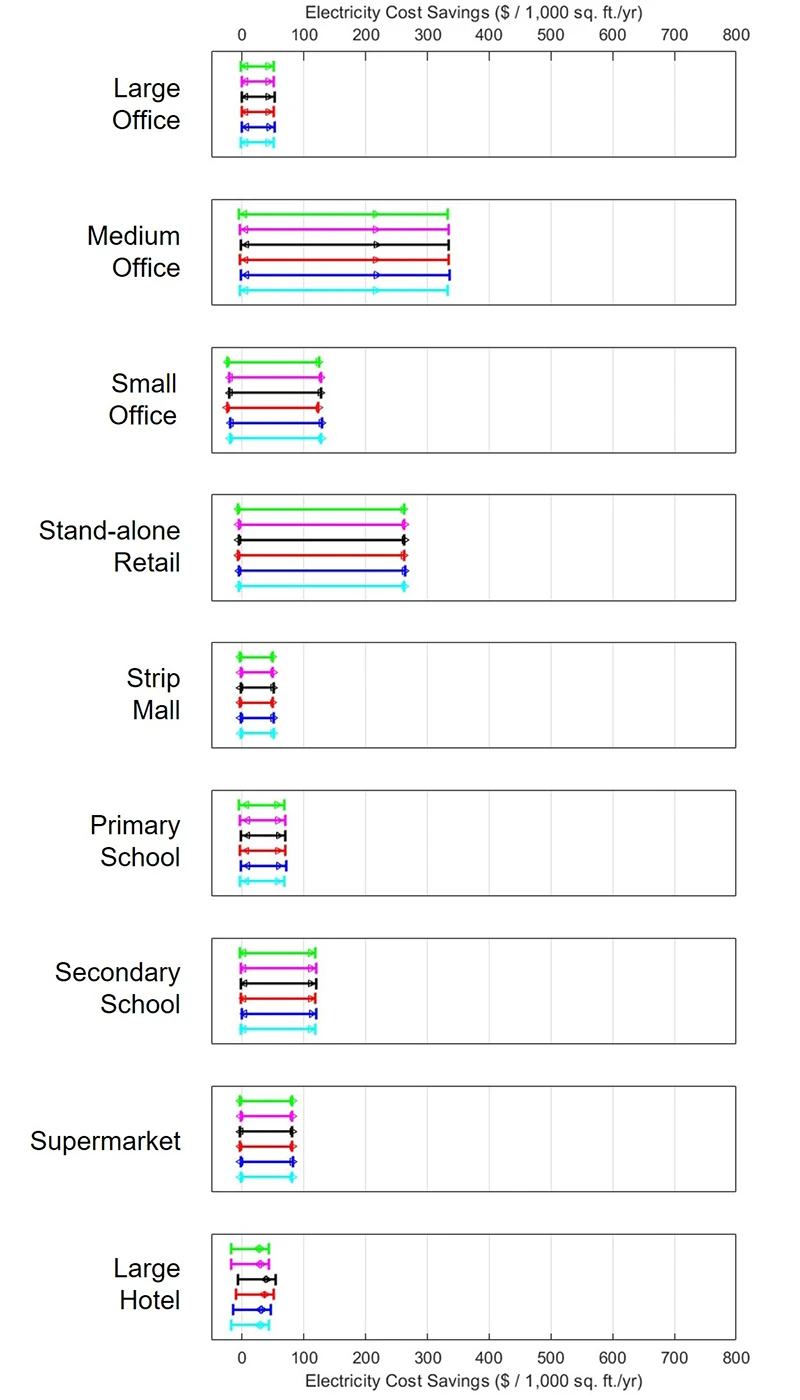
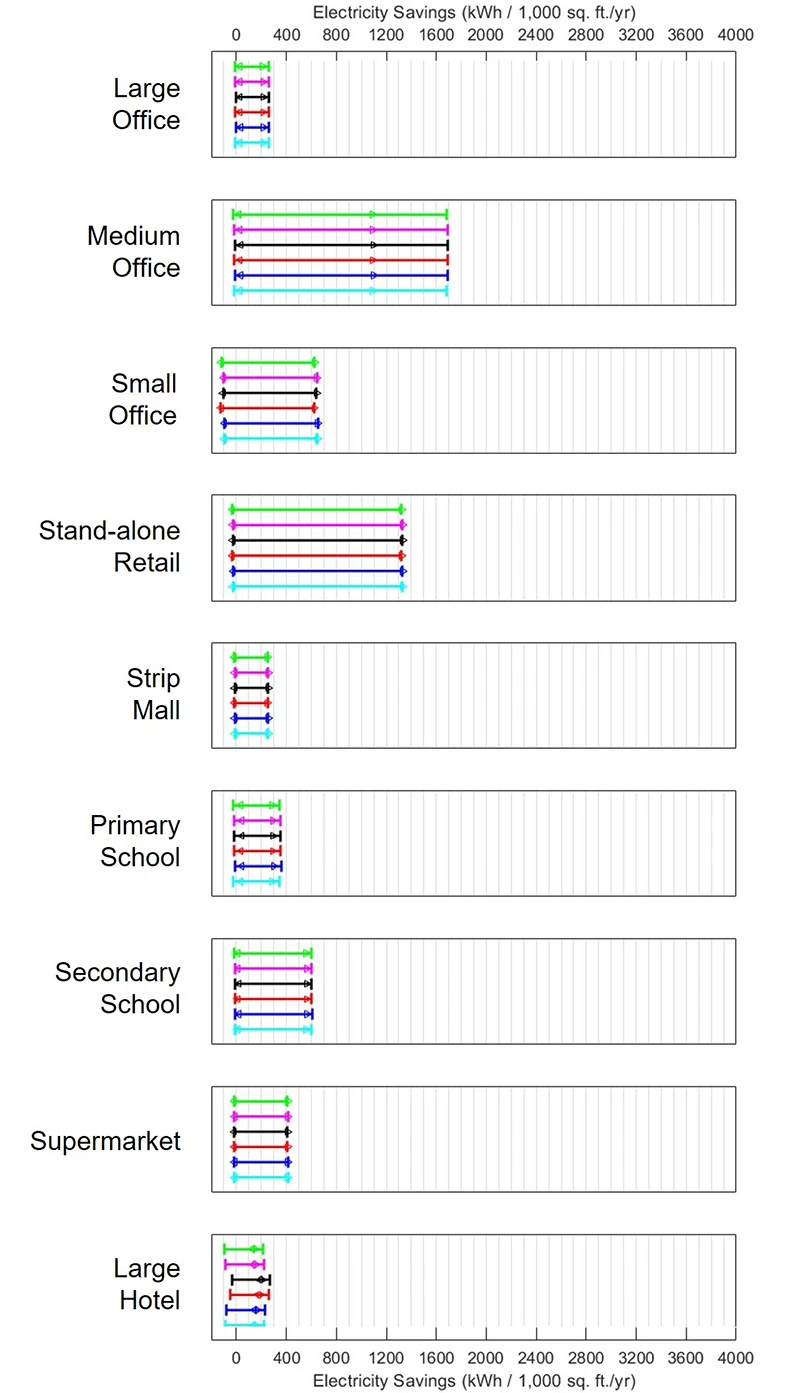
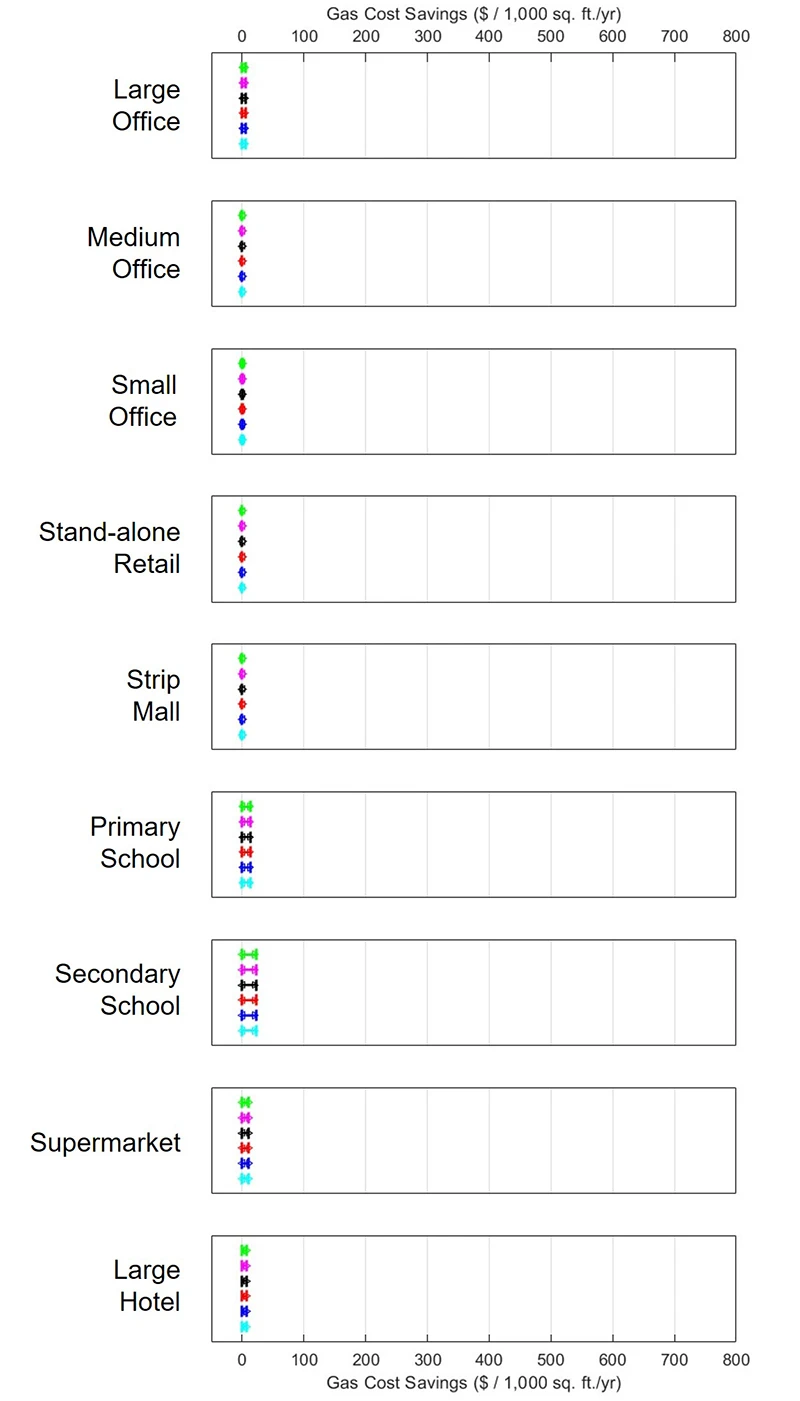
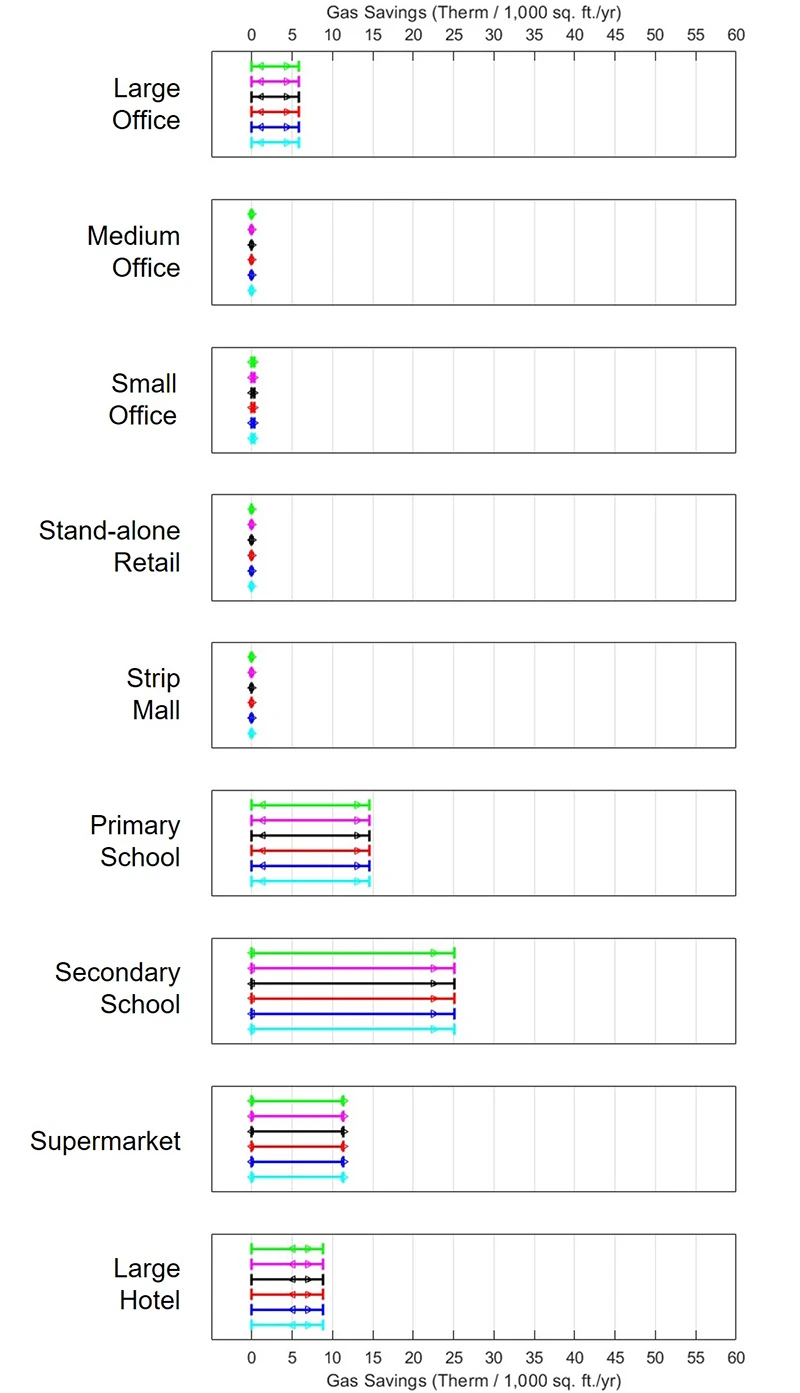
The plots below show a range of energy savings from implementing each BAS. There are four markers on each line that represent the following information:
- Minimum Savings – the energy consumed by the BAS components used in a building
- Keep in mind that the energy consumed by the BAS specified for a given building reduces the energy savings, thus the minimum savings is slightly negative.
The DOE commercial reference buildings define the building types, sizes and vintages, HVAC systems, baseline energy and schedules for both 3B (Los Angeles, CA) and 3C (San Francisco, CA) climate zones. The number of BAS building controllers and general/application-specific controllers were determined for each reference building type and vintage. Applying the power data collected for each BAS component and the schedule of the commercial reference buildings results in the total energy consumed by a BAS implemented in each commercial reference building type, vintage, and climate zone over the course of one year.
Energy cost savings are calculated by applying a rate of 0.1978 dollars per kilowatt hour ($ / kWh) for electricity use and 0.9354 dollars per Therm ($ / Therm) for gas use. Finally, the total annual cost per thousand square feet ($ / 1000 sq. ft. / year) of building floor space is calculated based on the total floor space of each buildings type. The electrical energy savings, gas savings and corresponding cost savings are provided in the plots below.
The true energy savings associated with a Building Automation System (BAS) is dependent on several details including but not limited to:
- Building characteristics:
- Use type
- Size
- Age
- Occupants
- Climate zone of the building
- Construction type
- Insulation
- Window types & glazing
- Interior/exterior surface material and colors
- HVAC system or other systems that the BAS is controlling
- Type
- Size
- Age
- Efficiency ratings
- Maintenance
- Baseline level energy consumption
- Building level energy consumption
- HVAC specific energy consumption
- BAS
- Control features currently being used with the existing BAS
- Number of BAS components being used with the existing BAS
- Number of BAS components being used with the existing BAS
- Calibration status of sensors
- Calibration status of BAS components
- Frequency to system analysis/re-tuning
- Control features added by the new BAS
These details make it difficult to put an exact number on the savings associated with a specific building, although estimates can be provided by a BAS integrator, an accredited engineering contractor, or an engineer.